Getting your exposure as best you can in camera is something that you should make as your goal every time you shoot. By doing this, you’re giving yourself more flexibility with editing and will have a more consistent look overall. One of the best ways to achieve this is by using your camera’s histogram. A histogram is a chart of your image’s tonal range showing what pixels have been exposed.
The right side represents the whites or highlights of an image, the middle is your mid-tones, and the The left side represents the blacks. Each one of the peaks shows how many pixels are in that tone. The tones run from 0-255: 0=black and 255 = white. Each one of these tones is one pixel wide, so the histogram can be compared to a bar graph where all the bars are packed in together. When one far side or the other (your whites or blacks) has a high bar touching at the far edge, this means you are “clipping” or losing the detail in either your highlights or shadows.
Here are some examples of Histograms that are visible within Lightroom and look similar to what would be in the back of your camera.
Example of an underexposed image or one with lots of shadows and no highlight areas.
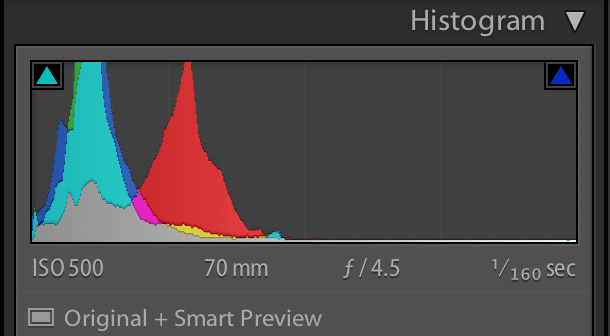
Example of an over exposed image (notice the clipping on the far right). Lots of highlights or bright spots with no shadows. If you were to bring the exposure back down while editing, there might not be much detail in the black areas of the image.
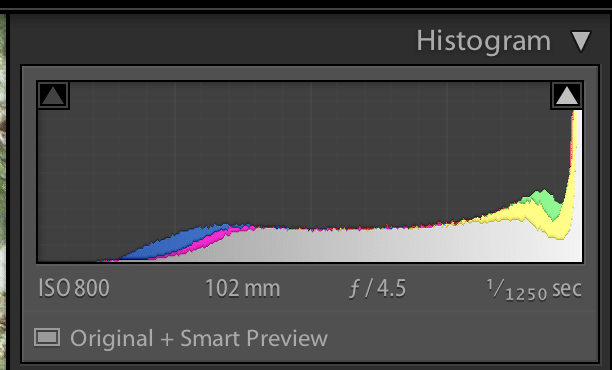
This is an image that had the best exposure for the scene. It was a portrait in the shade on a sunny day. So there were lots of shadows in the background where the greenery was, but the skin tones were brighter from the sun reflecting off surfaces back onto them. (But not so bright that we were “clipping” or losing detail.)
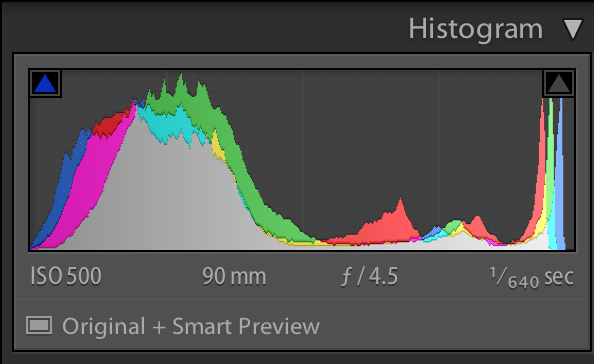
There is no “correct” way for your histogram to look. Each scene is going to be different and each photographer’s style is going to be different. If you someone who loves dramatic scenes, you might have a more contrasted histogram with higher bars on the left and right with lower in the middle. If you are someone who loves bright/light images, your histogram will lean more to the right. Understanding what your histogram means and your style will help you nail your exposure while you’re shooting.
Special note:
If you are someone who shoots in JPG, getting your exposure in camera is even more important. If you shoot RAW, you have more flexibility to fix or adjust your exposure in your post processing. However it’s still a good idea to practice getting right in camera.
